A lot of things are just copypasting information from other sources and organizing them in the way I understand.
Homepage | Official Documentation
When I was reading about pprof for the first time, I wanted to understand two things; what is it? and how to understand these graphs. I think I finally have some hold of both now, so here is my understanding of pprof in form of a blogpost in the simplest way. If you find any mistake, please feel free to comment in this issue. After reading this you should be able to make some sense of that graph and the options that we use in pprof should make more sense. But the official documantations are pretty great too!
First and foremost it is not one single thing, but a collection of tools and packages. It is tightly coupled with the go programming language and is widely used for profiling go programs. This is how I would breakdown pprof for my understanding:
go tool pprof: A tool visualization/analysingprofile data. Commonly refered to aspprof, I’ll call thisgo tool pprofthroughout the documentation just to avoid any confusion.runtime/pprof: A package that writes runtimeprofiling datain the format expected bygo tool pprof.net/http/pprof: A package that allows any program running a HTTP sever to serveprofiling datain the format expected bygo tool pprofprofile.proto: It is the data representation forprofile data, It’s a protocol buffer description. This is the format expected bygo tool pprof
Folowing sections give a little explanation to each of these and example to play with aswell!
Profiling
Before we start, It’s important to understand what profiling really is. Profiling refers to the collection of data that can reflect the execution status of the program during the execution of the program. In software engineering, performance analysis (also known as profiling) is a method of analyzing program behavior by collecting program run-time information. It is a method of dynamic program analysis. It is very useful for identifying expensive or frequently called sections of code.
Examples of profiling tools: gperftools, Linux perf tools etc, Interesting to know that pprof can work with perf.data aswell
Profiling with pprof
In case of pprof, each profile data is a collection of samples and is of the format profile.proto. The golang packages runtime/pprof and net/http/pprof helps in generating profile data and the pprof tool can generates reports out of the profile data to further visualize and analyze the data. The profile data can be read from a local file, or over http. Multiple profiles of the same type can be aggregated or compared, the pprof tool makes this very convnient.
- Basic usage can be found here.
- Profiling Go Programs
profile.proto
profile.proto is a Protocol Buffer v3 description file. It is the format that profile data uses. On disk, it is represented as a gzip-compressed protocol buffer. Eg. profile.pb.gz
Profile data represent data collected through statistical sampling of our programs; we call these samples. Each sample is associated to a point in a location hierarchy/call stack, one or more numeric values, and a set of labels. It is independent of the type of data being collected and the sampling process used to collect that data.
This allows custom pprof profiles. Additionally to what is provided by the runtime, Go users can create their custom profiles via pprof.Profile and use the existing tools to examine them.
go tool pprof
go tool pprof primarily does reporting by display the profile data in multiple forms, such as identifying hottest locations, building graphical call graphs or trees, etc which the user can further analyse to make their program work better or to identify bottlenecks.
It is primarily used in three ways:
- Report generation:
pprof <format> [options] source - Interactive terminal:
pprof [options] source - Web interface:
pprof -http[host]:[port] [options] source=
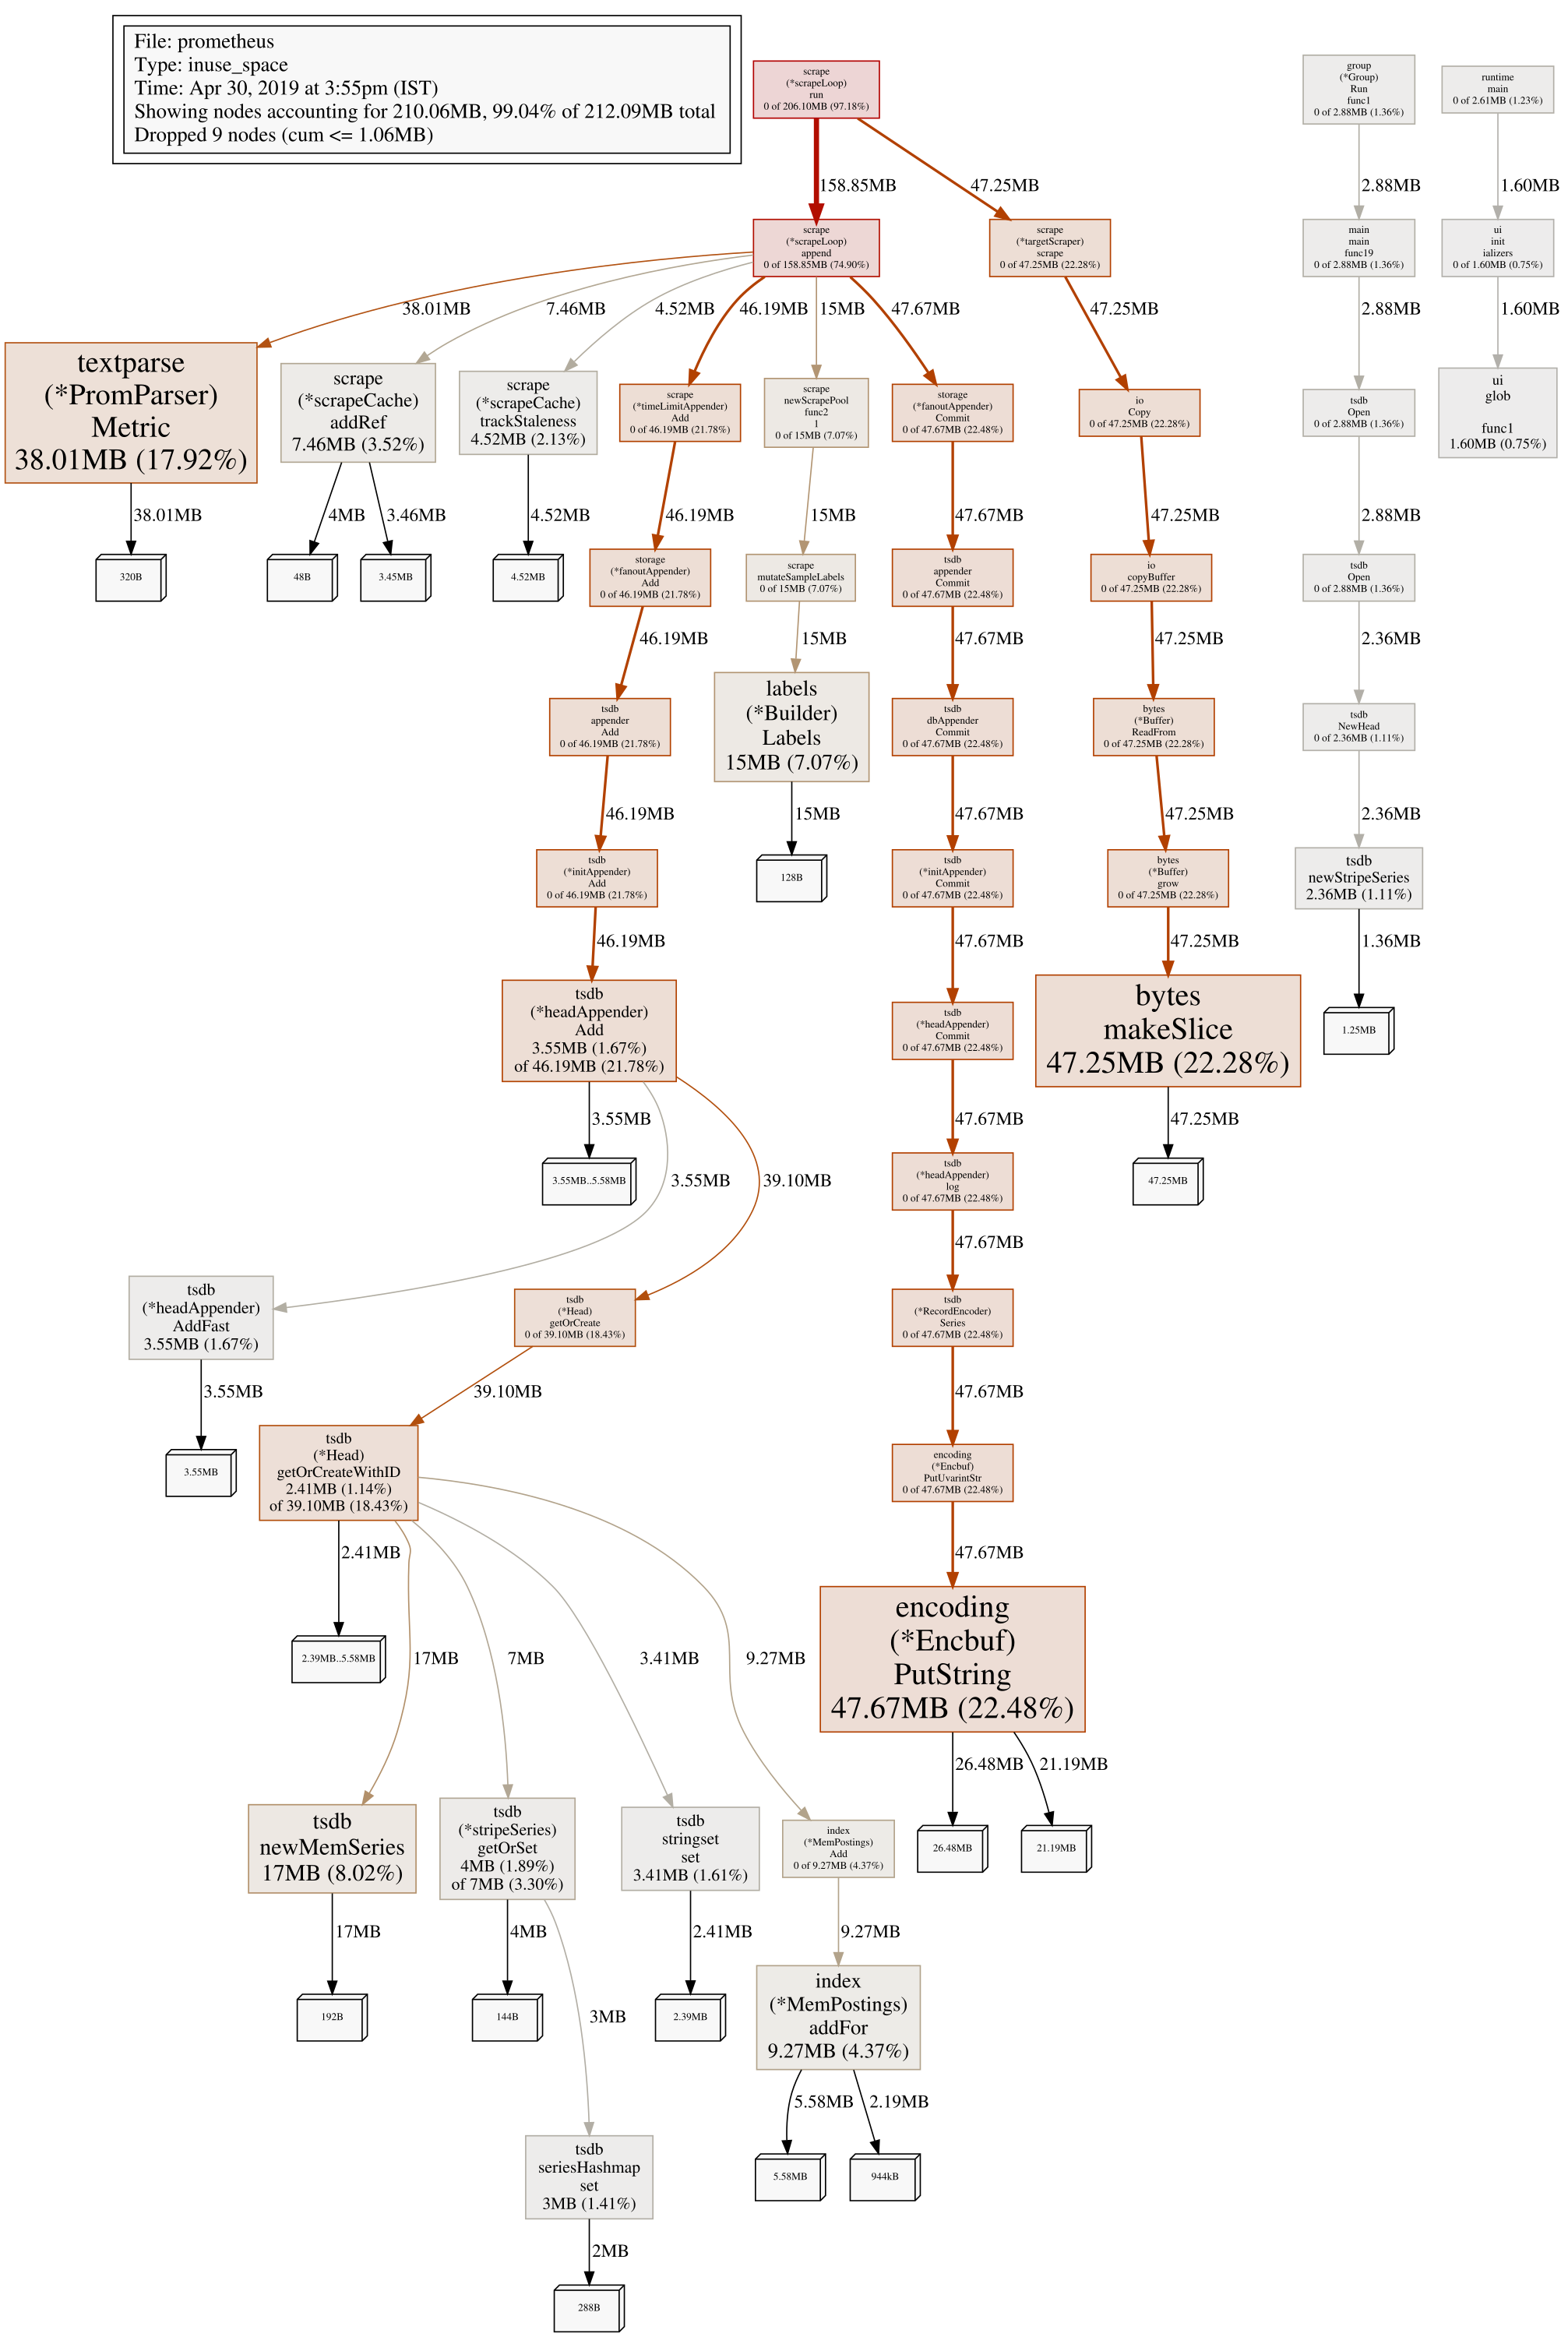
So the callgraph that I mentioned in the start of this post is just one of the many ways go tool pprof can visualize profile data. It probably uses Graphviz/=gv= and its DOT format for it, It also uses D3 for some other visualizations. In addition, it also supports exporting these visualizations into various common formats such as png, gif, pdf etc. The interpretation of the graph is very nicely explained here. Reading this was like switching on the light in a dark room. 💯
The help command to show all options is go tool pprof -h, I think the same options are described much better in the README
Aside on
flatandcumWhen using the
topcommand/view inpprofthere are few words that initially confused me; namelyflat,cumandsum.
flat: the value of the location itself.cum: the value of the location plus all its descendants.sum: sum is just this line and all lines before this one combined.b(){ c() // takes 1s do something directly; // takes 3s d() // takes 2s }
cumofb()would be 6s, andflatofb()would be 3s and thesum%will just say how much basically has been covered up to now.
Golang libraries
There are two packages that help profile your go programs:
- Runtime Profiling : Usually for non-HTTP applications/libbraries etc
runtime/pprof - Net Profiling: Good for live applications or applications that are already using a http server
net/http/pprof
pprof and production
- The profiler, for the most part, has very minimal CPU overhead. The execution tracer can have a small overhead, but still small enough that we happily run it in production for a few seconds each hour.
- Your pprof is showing
- The official debugging doc also has some notes on running
pprofin prod.
Other Projects
Resources
- [cite/t:b0rk] does pprof
- A decent pprof walkthrough
- Debugging performance issues in Go programs - Golang Wiki : Has an indepth explanation about each predefined profiles.
- golang pprof actual combat - A pprof practice : Post is not in english, use google translate; if you don’t have access to google you can probably read this directly.
- Golang Diagnostics
- How we tracked down (what seemed like) a memory leak in one of our Go microservices
- Deep decryption of pprof in go language
- Profiling Benchmarks