tags : Infrastructure,Database,Observability
Links
- Good summary: How To Query Prometheus on Ubuntu 14.04 Part 2 | DigitalOcean
- Good summary2: PromLabs | Blog - The Anatomy of a PromQL Query
PromQL
- Introduction to PromQL, the Prometheus query language | Grafana Labs
- PromQL queries for the rest of us
- PromCon EU 2019: PromQL for Mere Mortals - YouTube
- How the Prometheus rate() function works | MetricFire
- Cheat-sheet kinds
Alerting
Read
Doubts ⚠
Placement of by, are these the same?
sum by (job)(rate(http_requests_total{job="node"}[5m]))sum (rate(http_requests_total{job="node"}[5m])) by (job)- what are modifiers (offset, bool)
TODO Range Vector vs Range Selector vs Range Query?
- Different things?
- PromQL query and HTTP query different things obviously
| Terms | Description |
|---|---|
| Range Vector | |
| Range Vector Selector | |
| Range Query (HTTP) | |
| Range function | |
| Instant Vector | |
| Instant Vector Selector | |
| Instant Query (HTTP) |
Instant vector
- promql - Instant vector operations on prometheus range vectors - Stack Overflow
- Prometheus instant vector vs range vector - Stack Overflow
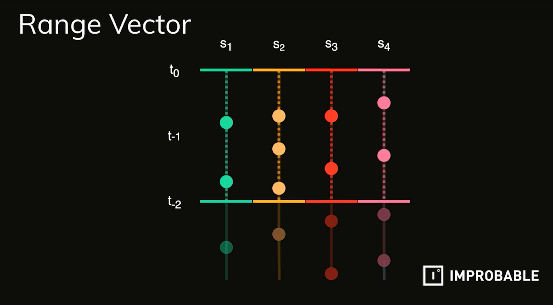
Range Vector
Range Vector Selector
Range function
Instant vs Range Query (HTTP)
- How to easily retrieve values from a range in Grafana using a stat panel | Grafana Labs
- What about “Only Instant Vectors can be graphed.”?
FAQ
Other Notes
- One word of warning when using timestamps on exported metrics, you can easily run into staleness problems which will create gaps in Prometheus. Or if the timestamp is too far off, Prometheus will drop the data entirely. - the great superQ
- https://github.com/cloudflare/pint
- Why are Prometheus queries hard? - Blog
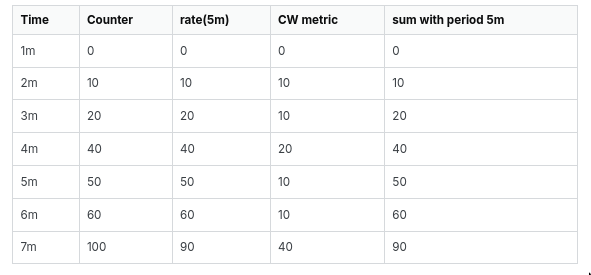
TSDB vs AWS Cloudwatch
Data Model
# stores values over time where the identifier stays the same.
<identifier> -> [(t0,v0), (t1,v1), ...]
t0 = int64, miliseconds unix timestamps
v0 = float64
# each of the following are totally different time series
prometheus_http_requests_total{code="200", handler="/api/v1/query", instance="localhost:9090", job="prometheus"}
prometheus_http_requests_total{code="200", handler="/graph", instance="localhost:9090", job="prometheus"}- We use metric name with labels for the
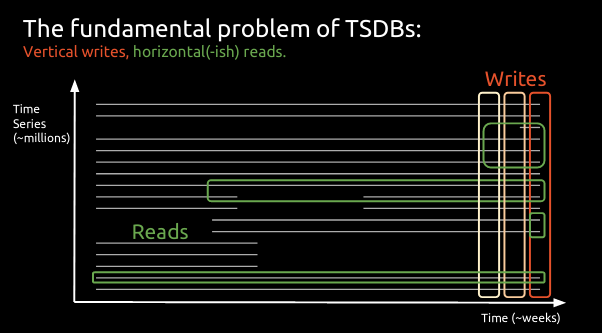
identifier - Vertical writes: In a short timeframe, we update every current active time series not necessarily at the same time but in one scrape cycle.
- On disk: Each two-hour block consists of a directory containing one or more chunk files that contain all time series samples for that window of time, as well as a metadata file and index file.
- index file: indexes metric names and labels to time series in the chunk files.
Functions & Operators
| Type | Sub Types | Operands (expression types) | Label dropping |
|---|---|---|---|
| Operators | Binary | Scalar & Instant Vectors | Does not drop labels, unless it’s the match label |
| Aggregation | Instant vectors | drops based on use of by / without | |
| Functions | - | Can be anything depending on the function | |
| Modifiers/keywords | - | depends, Eg. bool, on, ignoring, group-left etc. |
Operators
Binary
- Types
- Arithmetic binary operators
+ - \* / % ^ - Comparison binary operators
=!= > < >= <== - Logical/set binary operators
and (intersection) | or (union) | unless (complement)
- Arithmetic binary operators
- Works with both
scalarandinstant vectors; let&be some binary operator. - See official docs for proper info
| Operation Type | Evaluation | Resultant | Impact |
|---|---|---|---|
Arithmetic (+,- etc.) | Scalar & Scalar | Scalar | Scalar |
| Scalar & Instant Vector | Instant vector | Metric name dropped | |
| Instant Vector & Instant Vector | Instant vector | Metric name dropped, non-matching entries dropped, group labels added | |
Comparison (==,!=,>= etc.) | Scalar & Scalar | Scalar | w bool: 0 or 1 |
| Scalar & Instant Vector | Instant vector | w/o bool: drop, w bool: 0 if false, 1 if true | |
| Instant Vector & Instant Vector | Instant vector | Filter, w/o bool: drop not matching, w bool: 0 if false, 1 if true | |
Logical (and, or, etc.) | Scalar & Scalar | DOES NOT APPLY | |
| Scalar & Instant Vector | DOES NOT APPLY | ||
| Instant Vector & Instant Vector | Instant vector | Result depends on or, and / unless |
-
Matching for
instant vectors(onandignoring)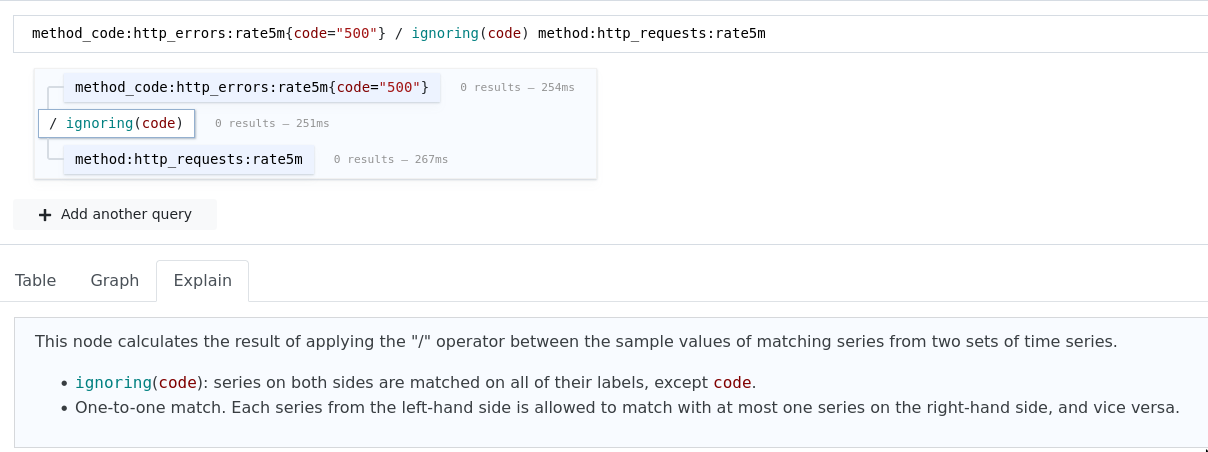
- When doing
instant vectorxinstant vectoroperation, we need to do matching of LHS & RHS- i.e For an
operationto happen betweeninstant-vector(s), they must “match”. To make things match, we can useonandignoringas needed. - Simply using
onandignoringhandles 1-1 matches, which is OK in most cases. - If we want
n-1/1-nwe need to use thegroup-right,group-leftmodifiers.
- i.e For an
matchinghappens based on two keywords:onandignoring- These keywords are sort of part of the
operationrather than the operand. i.e if you’re doingX / on(abc) Yit’s (X,/ on(abc),Y). Theonmodifier says, only do/when things match onabc. - We provide the
labelsto match on toon/ignoring
- These keywords are sort of part of the
- When doing
Aggregation
- only takes
instant vectorsas inputs and only returninstant vectorsas outputs. Eg.sum,min,max,stddev,stdvar
Modifiers
boolis a modifier, you usually use them right after theoperatator(Eg. w/o bool:something==1, w bool:something == bool 1)onwithout a label param matches things on all
Functions
Takes argument of any promql type, gives output in any promql type.
rate(v range_vector)
- It should be always used with
countervariables as it calculates the per second increase of yourcounterin the specified time range. - It makes no sense of taking
rateof agaugevariable. - It’s a good rule not never compare raw counters and always use
rate(),ratemakes use of all the datapoints returned by the range vector unlikedeltabecause it returns the per-second average rate of increase of the time series in the range vector. - Use
ratefor alerts and slow-moving counters, a small dip in the rate can reset theFORclause when alerting if usingirateso prefer usingrate. irate=/instant rate is basically taking =rateof the last two samples; i.e looks back at the last two samples under a sliding window.irateshould only be used when graphing volatile, fast-moving counters. See comparison here.
When taking
rateit’s advisable to take the range time-frame be4xthe scraping interval. Prometheus defaultscrape_intervalis 15s so it should be minimum1mbecauserateneeds at least two data points to calculate the rate of increase.
-
More on
rate
Querying
There are terms such as Instant Queries,Range Queries, Instant and Range vector selectors, Offset Modifiers, Subqueries, the time, start and end query parameters, grafana’s $__interval, steps and resolutions, which can be pretty intimidating at first to understand how all these relate. The documentation actually explains everything nicely but here’s a summary.
There are basically 2 ways you can select time series, they are called the time series selectors;
- instant vector selectors
- range vector selectors.
The offset modifier can be used to get historical instant or range vectors which can be useful for alerts when comparing against the past.
Instant vs Range vectors (Incorrect)
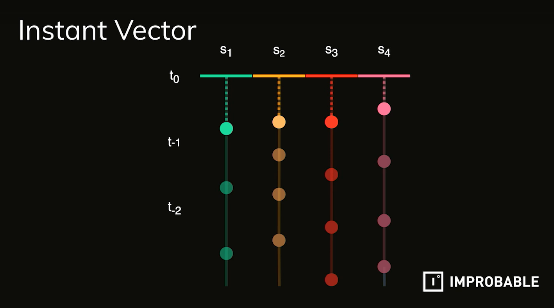
Instant vector returns the most recent value for any time series. This is how are we getting an instant vector at any(past,present) point in time even if the scrapes are happening at specific intervals.
Range query basically just dumps samples back from the current instant. The timestamps for different timeseries will mostly be different but the it’s interesting to notice that the samples mostly differ by the
scrape_interval.
The API
Request and Response combinations (INCORRECT)
- THIS PART MIXES range query with range vector , this is super wrong. A range query can return an instant vector/scalar other things. i.e ValScalar ValVector ValMatrix ValString
- See https://pkg.go.dev/github.com/prometheus/client_golang/api/prometheus/v1#API for
QueryRangeand its return type.
- i.e range query and range vector have no direct relation
- Following needs fixing, i’ll comeback later.
-
Instant Vector
See the parameters here.
endpoint query notes resposeType/queryinstant vector with timeThe prometheus UI in console mode uses this. vector /queryinstant vector with timeandoffsetEven if offset is set and values will be different, the timestamp of an instant vector result is always that of the evaluation time.vector /query_rangeinstant vector with start,endandstepThe prometheus UI in graph mode and grafana uses this to get instant vectors to plot. matrix /query_rangeinstant vector with start,end,stepandoffsetSimilar to /querywithoffsetmatrix
-
Range Vector
See the parameters here.
endpoint query notes resposeType/queryrange vector with time- matrix /queryrange vector with timeandoffsetThe timestamps shown will be from the time of the offsetmatrix /query_rangerange vector with start,endandstepNot Allowed - /query_rangerange vector with start,end,stepandoffsetNot Allowed -
Steps and Resolution
These are specific to range queries(
/query_range).Instant queries(
/query) do not have astepparameter, as they are evaluated at a single point in time (the current time, or a custom time if set)
Resolution in promethus world can be measured in seconds, eg. 1ms resolution > 1s resolution. 1ms resolution will have way higher noise. When querying prometheus data, we can use the step parameter in /query_range to set our resolution, which then evaluates the given query at each step independent of the stored samples. So we can represent larger time ranges without being accurate enough.
Sometimes query step/query resolution/resolution step/evaluation step/=interval=(source) are used interchangbly. The=step=,=start=and=end= paratemeters determines how many points you will get back.
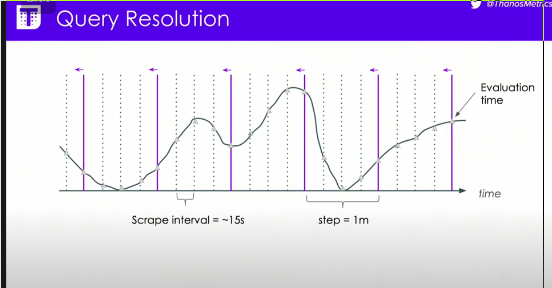
What if you specify a resolution of
5sfor a time series scraped withscape_intervalset to1m, Prometheus doesn’t have more datapoints to evaluate!This explanation is equally true for any value for the resolution. Sample timestamps for different time series can be at arbitrary intervals and not time-aligned with each other but you still need to be able to select multiple series and aggregate over them, so they need to be artificially aligned.
The way promql does this by having an independent
evaluation interval(the resolutionstepthat you chose) for the query as a whole, independent of the underlying details of the data. Soscrape_interval=1mandstep=5s, simply means that new data is put into the time series at everyscrape_intervalbut query is evaluated at eachstepfor every timeseries that is matched for that identifier. Functions likeratedon’t know whether they’re being called as part of a range query, nor do they know what the step is.promql engine basically runs an evaluation loop where we start at the range’s start timestamp, then increase the timestamp by interval on every iteration, and abort the loop when the timestamp becomes larger than the range’s end timestamp.
Example timeseries:
[(t,v)] => [(1,1),(4,4),(7,7),(11,11),(15,15)]Running the evaluation loop on this time series with
start=0,=end=16= andstep=5will give us[(0,0),(5,4),(10,7),(15,15)]PromQL selects the value of the sample that is the most recent before (or exactly at) the
evaluation steptimestamp, it never looks at “future” data, so fort=0=/=start=0, the result would simply be empty instead of1.
Prometheus UI and Grafana
Grafana has a few parameters/options to access the prometheus api endpoints in a few different ways, it’s best to consult the official grafana prometheus datasource doc.
Since Grafana has to deal with graphs and not just the metrics, it has to take extra care when plotting things so that there is never more data points than the the number of has pixels the graph has etc. It has few options which can be easily confused with what parameters prometheus api takes in.
Tweaking these grafanap options really depends on what one wants to see in the graph, but there are some variables and options which are not well stated in the official documentation.
$__interval(seconds) : It is a global variable that is dinamically calculated based on the time range and the width of the graph(the number of pixels). There are the$__fromand$__tovariables to specify timerange, . The formula is$__interval = ( $__from - $__to)/resolution, resolution here means the display resolution(the width of the panel). For example, If the panel is1099pxwide and time range is24h = 86400s,$__interval = 86400/1099 = 78s,78sis then rounded up to2mwhich is then set to the$__intervalvariable.- When using the prometheus data source, the value of the
$__intervalvariable is used as thestepparameter for the prometheus range queries(/query_range) - In the prometheus query editor we get another option called
Resolutionwhich is a ratio(1/1,=1/2=,…).Resolutionhere basically means how many pixels per datapoint, (1/1>1/10) This basically modifies the$__intervalvariable ergo thestep.
Example,
- If
$__intervalwas2mandResolutionwas set to1/1,stepwould be2m.- If
$__intervalwas2mandResolutionwas set to1/2,stepwould be2m=x2==4m.
-
The minimum value of
stepis (or can be) limited in various ways, both for the entire panel of queries (Min interval) and in the individual metrics queries (Min step) -
In grafana you can make your
rate()range intervals auto-adjust to fit thesteps. One could use$__intervalto choose an appropriate value such asrate(a_metric_name[$__interval])for the range vector. -
The range interval you likely want to use for
rate()depends partly on your query step:- Might want the
rate()range interval of thequery step - Might want the
rate()range somewhat more than thequery step - If we try to do something like
rate(metric_name[3s])where thestepgreater than the range of the vector, we’ll undersample and skip over some data! because now range durations only include one metric point and none ofrateoriratecan operate on one data point.
- Might want the
-
There is also the
$__range,=__range_msvariables which is basicallyto - from` (CONFUSION!!!) -
Takeaway, when working with prometheus and Grafana there are 3 different meanings of the same word resolution. The actual prometheus resolution/=step=(seconds), The panel width resolution and the
Resolutionratio option of the prometheus datasource.
Issues
- In console mode, Older react UI on time increment just increments by 10 mins, the new react UI does that by 30 mins. Sometime it increments the microseconds in the classic UI. weird.
- This article points to some more complex senarios.
Stallness
- At every resolution timestep, for every series the PromQL expression references, the last sample value is chosen (if it is not older than the staleness period of 5 minutes).
- Note that there will be always one returned sample for every increment of the interval (5), even if it would be the same repeated value from the same sample (if “real” samples are less frequent than the eval step). The exception is when there is an explicit staleness marker or the last sample for a given series is >5min before the evaluation timestamp (promql.LookbackDelta = 5 * time.Minute).
- https://www.robustperception.io/staleness-and-promql
- https://github.com/prometheus/prometheus/pull/7011
- https://github.com/prometheus/prometheus/issues/398
- https://promcon.io/2017-munich/talks/staleness-in-prometheus-2-0/
Subquery
- https://prometheus.io/blog/2019/01/28/subquery-support/
- https://utcc.utoronto.ca/~cks/space/blog/sysadmin/PrometheusSubqueriesForSpikes
- https://utcc.utoronto.ca/~cks/space/blog/sysadmin/PrometheusSubqueriesDefaultStep
- https://utcc.utoronto.ca/~cks/space/blog/sysadmin/PrometheusSubqueriesMathOverTime