tags : Observability, PromQL
FAQ
Tactical stuff
Measuring latency
- A system like Prometheus aggregates across time to work efficiently. So you can calculate things like mean latency, but you can’t see individual request latency. Eg. with python we can use prometheus histograms.
Service Discovery
AWS ECS
- Service discovery - Amazon Elastic Container Service
- Seems like there are couple of ways to do it because ECS-SD is somewhat not supported officially.
- Prometheus on ECS - Proof of Concept | 3h4x.github.io
- This uses teralytics/prometheus-ecs-discovery
- Then there is aws suggested methods
- Prometheus on ECS - Proof of Concept | 3h4x.github.io
Exposing endpoints
What do we want to expose, prometheus or grafana?
- Assuming a user would need to access the prometheus UI
- This really is not a question about prometheus/grafana but more of a question about Infrastructure Security. (when Selfhosting)
- In some cases companies keep their grafana instance publicly accessible from the internet but behind some auth. (Usually behind reverse Proxies) and the prometheus instance sits in a private subnet etc.
- In other cases, both prometheus and grafana might be in a private subnet and you need to be in the VPC through a VPN or something similar to be in the same network. Otherwise, things can be public and firewalls etc can be used.
Can we expose on trusted networks?
- Depends on security posture
- Exposing that port on a “trusted” network is a possible attack vector for bad actors.
- Exposing that port on the open internet (as is often the case) is an open invitation for attack.
Exposing prometheus/grafana
This is about protecting the endpoints provided by the prometheus binary
- By making it public
- Auth + RP + Firewall rules for limited access
- Protecting Prometheus: Insecure configuration exposes secrets
- By not making it public (private subnet)
- Use a VPN
- Instead of using a VPN we could use other solutions, such as
- Enable Prometheus to Scrape Anything from Anywhere | OpenZiti
- https://medium.com/@dnorth98/hello-aws-session-manager-farewell-ssh-7fdfa4134696
- Connect to an AWS VPC using subnet routes · Tailscale Docs
- AWS reference architecture · Tailscale Docs
- Run a Tailscale VPN relay on ECS/Fargate - Platformers
- Access AWS RDS privately using Tailscale · Tailscale Docs
Exposing applications exposing prometheus metrics
- Exposing /metrics endpoint to public internet
- Blocking access to path at load balancer/reverse proxy seems like a good way to do it
- The service would be accessible from the VPC anyway, so the prometheus collector instance will be able to scrape it using the private IP/whatever it gets from service discovery.
Instrumentation
Go (client-go)
Meta notes
- When you simply use the metrics primitives, registering them and then exposing using
promhttp.HandlerFor, you just get those metrics and some error metric. You don’t get the go and process collector metrics etc. - Cause of inconsistencies
- If a metric inconsistent
- If a metric is equal to the new metric already registered.
-
Registry
Collector & Metrichave to describe themselves to theregistry.- Because inconsistencies are supposed to be detected at registration time, not at collect time.
- Usually you’d use the
DefaultRegistry- Comes registered with
NewGoCollectorandNewProcessCollector
- Comes registered with
- Custom Registry
- Implement your own
Register/Gatherer - Special properties, see NewPedanticRegistry.
- Avoid global state, as imposed by DefaultRegisterer.
- Use multiple registries at the same time to expose different metrics in different ways.
- Separate registries for testing purposes.
- Implement your own
-
Gatherer
Registryimplements theGathererinterface.- The caller of the Gather method can then expose the gathered metrics in some way.
-
Metric Types & Vector metric types
- You need
<MetricName>Optsfor creation - Fundamental metric types
- Gauge, Counter, Summary, and Histogram
- Implement the
Metricinterface Gauge, Counter, Summary, Histogramare interfaces themselves (These embed theMetricandCollectorinterfaces)
- Vector metric types
- GaugeVec, CounterVec, SummaryVec, and HistogramVec
- This is when we partition samples along dimensions called “labels”
- Implement the
Metricinterface and theCollectorinterface GaugeVec, CounterVec, SummaryVec, HistogramVecare NOT interfaces themselves
- You need
-
Collector
- A
Collectormanages the collection of a number of Metrics - For convenience, a
Metriccan also “collect itself”. - Creation of the
Metricinstance happens in theCollectmethod. - Usually you would not implement custom
Metricbut might implement customCollector
-
Why custom collector?
- Usecase1: A custom Collector seems handy to bundle
Metricsfor “common registration” - Usecase2: Already have metrics outside of prometheus context, “mirror” existing numbers into Metrics during collection.
- Metric instances “on the fly” using
NewConstMetric, NewConstHistogram, andNewConstSummary(alsoMustversions)NewConstMetricfor a float64 value:Counter, Gauge, and a special “type” calledUntyped(When unsure ofCounterorGauge)- Convenience functions:
GaugeFunc, CounterFunc, or UntypedFunc
- The
processCollector,goCollector,expvarCollectorare collectors used for “mirroring” purposes.
- Metric instances “on the fly” using
- Usecase1: A custom Collector seems handy to bundle
-
Unchecked vs check collector
- scrape inconsistencies
- When exact metrics to be returned by a Collector cannot be predicted at registration time, but the implementer has sufficient knowledge of the whole system to guarantee metric consistency.
- A
- Instrumented Handler vs Uninstrumented Handler
Packages
-
prometheus
- What it offers
- Primitives to instrument
- Eg.
NewGauge,NewCounterVecetc.
- Eg.
- Registry for metrics
- Eg. You use
prometheus.Registerer.MusRegisterfor each metric
- Eg. You use
- Primitives to instrument
- What it offers
-
promhttp
- Expose registered metrics via http
- Has
Handler()- Can think of it as a convenience function
- sort of same was using
InstrumentMetricHandlerwithHandlerFor
HandlerFor- Takes in
prometheus.Gathererandpromhttp.HandlerOpts - HandlerOpts defines the behavior of the returned Handler
- Custom instrumentation/Gathers etc.
- Takes in
-
promauto
- Metrics constructors with automatic registration.
- When you are not concerned with fine-grained control of when and how to register metrics with the registry
- Allows you to ignore registration altogether in simple cases.
- Provides constructors
- Top-level functions
- Return Collectors registered with the global registry (
prometheus.DefaultRegisterer)
- Return Collectors registered with the global registry (
- Set are methods of the Factory type
- Return Collectors registered with the
custom registrythe Factory was constructed with. - Using
prometheus.NewRegistry()andpromauto.With(reg)
- Return Collectors registered with the
- Top-level functions
-
Registration Panicking
- Input provided by the caller that is invalid on its own.
- Incompatible metric is added to an unrelated part of the code
- With global registry
- Where simply importing another package can trigger a panic
- If the newly imported package registers metrics in its init function
- Steps with vanilla
prometheus- You first create the metric/collectors
- Decide explicitly if you want to register it with a local or the global registry
- Decide if you want to handle the error or risk a panic.
- Steps with vanilla
promauto- Registration is automatic
- If it fails, it will always panic.
- Constructors will often be called in the var section of a file
- Which means that panicking will happen as a side effect of merely importing a package.
-
push
- Push registered metrics
Instrumenting Batch Jobs
- Instrumenting long running services is straight-forward to think about. Batch jobs are somewhat harder to wrap the head around what to include, how to include etc.
- See the “what to monitor/batch job” section in Observability for some more concrete reference
Gotchas/Tips
- Cardinality
- Don’t have job-run-id as a label due to cardinality, you can have by job-name.
- But now how do you differentiate between different runs? For many things we’ll be using the
gaugeinstrument in which only what’s thelast valuematters. In this case if you have multiple jobs and no differentiating label, the resulting metric for that series will be confusing.- In most of these cases you’ll have
gauge with no labels, eg. outcome of a job can be indicated with a gauge with0/1value with no labels.
- In most of these cases you’ll have
- However, if it’s a type of job and there’s a guarantee that there will be no concurrent runs of it then not having the
job-run-idis not a problem because the data will be time series and we’ll see gaps between runs when we visualize the data and things would make sense
- But now how do you differentiate between different runs? For many things we’ll be using the
- If you want per row metric or something when running the job, you most of the time want to be logging that and process it later using recorded queries or something similar.
- So basically two ways
- Either you push the metrics for each run whenever it is done and are OK with losing some of the metrics
- Or go with a separate tool that parses the output files(eg. logs) of your script runs and aggregates everything somehow
- Don’t have job-run-id as a label due to cardinality, you can have by job-name.
- Model
- It has to follow a push model instead of a pull one. Eg. As the script completes, it can push the metrics (e.g. req. duration histogram, CPU utilization, peak memory etc.)
- This push model can be implemented via pushgateway and if you’re using OTEL(See Observability) then you can just use the OTEL Collector(eg. Grafana Alloy)
OTEL instrumentation
Metrics API
- I think usually you’d just need one
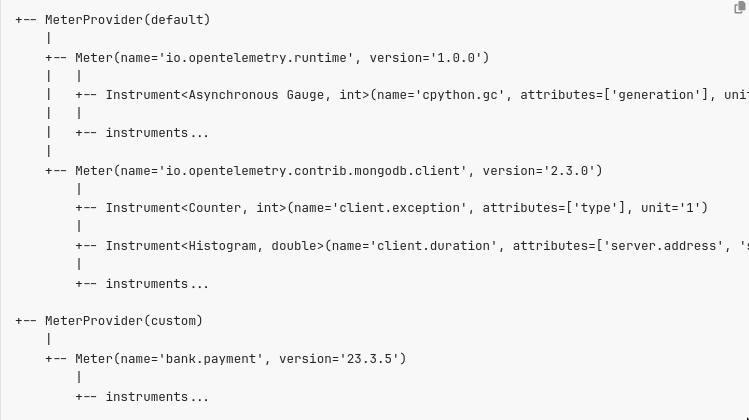
MeterProviderand is expected to beglobal- All configuration should happen at
MeterProvidernot in theMeter
- All configuration should happen at
Meterprovides creation methods for variousInstrument(s)- an
Instrumentis mapped to aMeterduring “creation”
- an
Instruments
- NOTE: Whether an instrument is int/Float is
identifying - Instrument names can be max 255 chars and case-insensitive.
unitis optional- Variants
Sync: Invoked inline with application/business processing logic.- Eg. How many bytes were transmitted
- The
Measurementcan be associated withContext
Async: Register callbacks that invoked on demand (SDKcollection)- Eg. Async gauge can collect info from source every 15s (i.e callback invoked every 15s)
- The
MeasurementCANNOT be associated withContext - Callbacks
- Callback functions will be called only when the Meter is being observed.
- Callbacks can be registered/unregistered after after asynchronous instrumentation creation also
- Callbacks should be reentrant safe
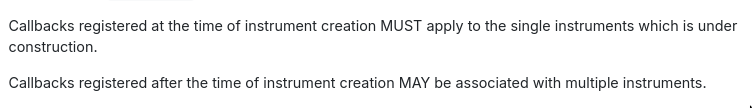
- Multi-instrument callback
- Callback that’s associated w multiple instruments
- The API MUST treat observations from a single callback as logically taking place at a single instant, such that when recorded, observations from a single callback MUST be reported with identical timestamps.
- The
Async Instrumenthasregister_callbackand the callback itself will haveunregister
- Attributes
- These can be registered at Instrument creation time
- API should also be flexible to provide ad-hoc attributes at invocation time
UpDown
| Instrument Kind | Variant | Operations | Eg. |
|---|---|---|---|
| Counter (+ve increment) | Sync | Add (does not return anything) | No. of req, No. of bytes |
| Counter (+ve increment) | Async | Callback (returns absolute value: list/observable result) | CPU time by program, Total process heap size |
| Gauge (non-additive) | Sync | Record, on-change -> Record (Based on change events) | Background Noise |
| Gauge (non-additive) | Async | Callback, accessors -> Observable record | Room temperature |
| UpDownCounter (additive) | Sync | Add (takes in increment/delta value) | Total heap size, No. of “active” req, No. of items in queue |
| UpDownCounter (additive) | Async | Callback | Total heap size |
| Histogram | Sync | Record | Req. Duration, Size of Payload |
Measurement
- Consist of
value:(attributes)
TODO Metrics SDK
https://opentelemetry.io/docs/specs/otel/metrics/sdk/ (TODO: To read, read only like 30% of it)
MeterProviderMUST provide a way to allow aResourceto be specifiedshutdownmethodForceFlushmethod- Works only on
push metrics - Does not work on
pull metrics(by design)
- Works only on
- Components
MetricReadersMetricExportersViews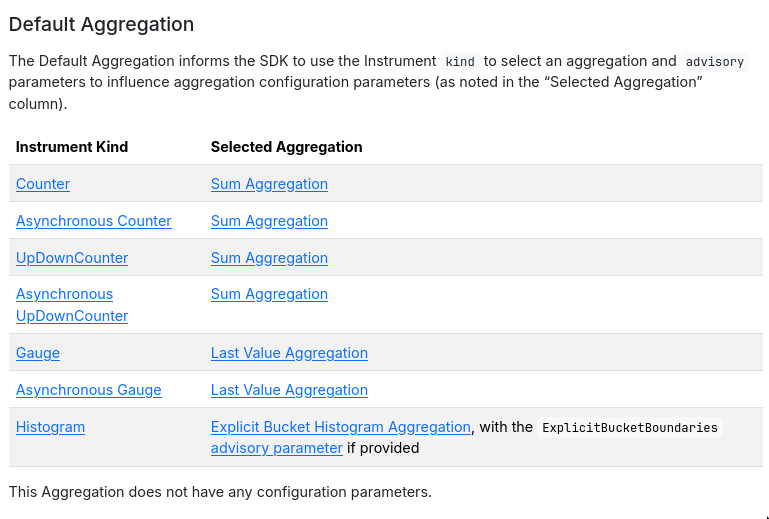
- Determines the
aggregationtype- (
Drop,~Default,Sum,Last Value,Explicit Bucket Histogram)
- (
- An instrumented library can provide both temperature and humidity, but the application developer might only want temperature.
- If
MeterProviderhas no View registered, take the Instrument and apply the default Aggregation
- Determines the
Concepts
Relabeling
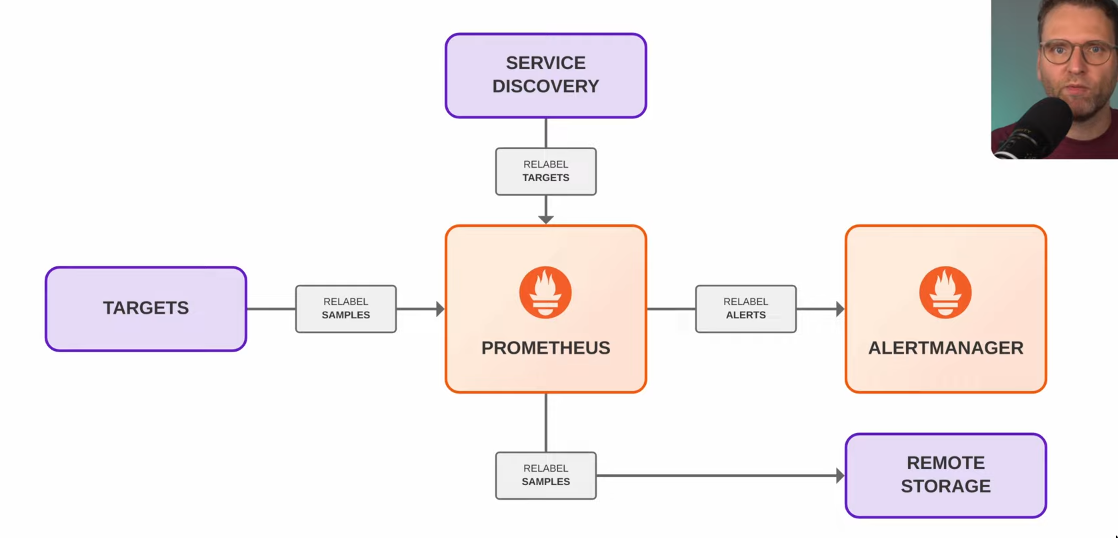
- Can be applied to
- Targets:
relabel_configs - Metric samples:
metric_relabel_configs- Remote write:
write_relabel_configs
- Remote write:
- Alerts:
alert_relabel_configs - See relabel_configs vs metric_relabel_configs – Robust Perception
- Targets:
- Action
- Change
- Filter
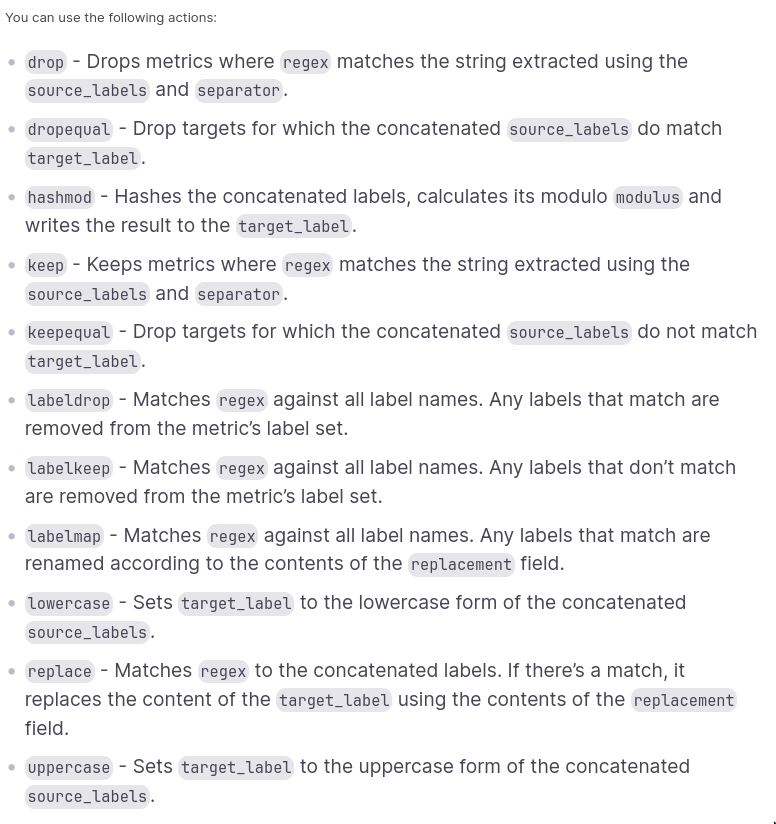
List of possible actions
Rules
source_labelsspecificregex- When using
regexyou must have areplacementconfig set. It can be the capture group or a static string. regexis matched against the value contained in thesource_label
- When using
separator- Use this as a utility to join different label values into the target Eg.
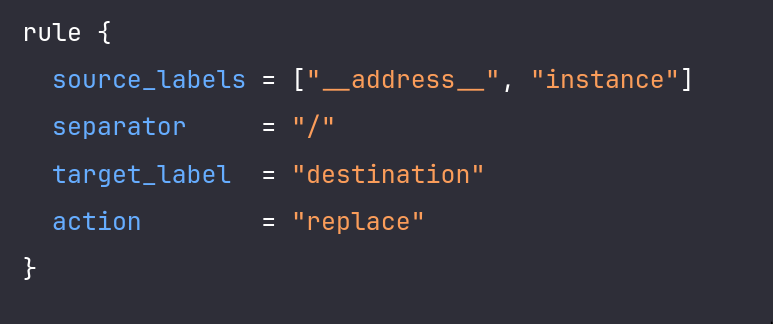
- Use this as a utility to join different label values into the target Eg.
target_labelwill be the final label andreplacementwill be the value of thetarget_label
- action:
labeldroplabeldropneeds theregexfield, and needs nothing else.labeldropaction is applied unconditionally to every label of every metric.- We cannot conditionally select certain series and labeldrop on them.
- We can however do target_label replacement as shown in this SO answer: prometheus - Conditionally drop labels - Stack Overflow
- Otherwise I think we could also have multiple scrape targets for the same endpoint and keep different set of metrics but this would make the config look ugly i think.
- Drop label for single metric only, not for entire scrape job
- Rationale behind Prometheus Labeldrop Action - Stack Overflow
Gotchas/Tips
- Labels starting with a double underscore (
__) are automatically removed after the last relabeling rule. - After relabeling, Prometheus sets the
instancelabel to the value of__address__if you do not set theinstancelabel explicitly to another value before that. - service discovery(SD) mechanisms can provide a set of labels starting with
__meta_that contain discovery-specific metadata about a target. labelmapis nice if you want to preserve the SD__metalabels with a different prefix
Histograms
- Histograms and summaries | Prometheus
- Prometheus Histograms. Run that past me again? | akuszyk.com
- How does a Prometheus Histogram work? – Robust Perception | Prometheus Monitoring Experts
- How does a Prometheus Summary work? – Robust Perception | Prometheus Monitoring Experts
- https://medium.com/mercari-engineering/have-you-been-using-histogram-metrics-correctly-730c9547a7a9
- https://bryce.fisher-fleig.org/prometheus-histograms/
- Histograms for Probability Density Estimation: A Primer | Hacker News