tags : Kubernetes, PromQL, Logging, Prometheus
FAQ
What about Performance?
- I’ll have another page when I have it, but for now, this be it.
- Outside scope of Observability but consider things like
- Universal Scalability Law
- Amdahl’s law (system limited by the seq processes)
- Little’s law
- Kernel/Compiler level optimizations
- See Perf Little Book
Monitoring from business prespective
- Looking at the customer experience
What?
- It’s about bring better visibility into the system
- It’s a property of a system. Degree of system’s observability is the degree to which it can be debugged.
- Failure needs to be embraced
- Once we have the info, we also need to know how to examine the info
- We want to understand
health, we want to understandchange- We want to know “What caused that change?”
Checklist
- Observability is not purely an operational concern.
- Allows test in prod.
- Reproducible failures
- Rollback/Forward flexibility
- Allows us to understand it when it runs
- Let’s us dig deeper v/s just let us know about the issue
- Let’s us debug better w evidence v/s conjecture/hypothesis
The levels
Primary
- Logs, Metrics, Traces
- These need to be used in the right way to attain needed observability
-
Logs
- See Logging
- We don’t tolerate loss here. Because we need this shit so we can query a needle in the haysack
-
Metrics
- System centric
-
Traces
- Request centric
- Most other tooling suggests you take proactive approaches which are useful for known issues. When you are debugging production systems you are trying to understand previously unknown issues. This is why tracing is useful.
Secondary
-
Events
- Similar to logging, but more interesting to a human’s specific usecase than normal logs.
- Difference (Eg. webserver)
- Log: every request (whether to log every http request or no can be debatable)
- Event: unhandled exceptions, config file changes, or 5xx error codes etc.
- I think, with structured logging, this distinction is not really necessary if we’re looking for the correct events in the logs in an automated way
- Unlike logs, events (either from somewhere or extracted out of logs) can be rendered in dashboards on top of visualized metric data. Might help w relating things, eg. metric spikes with an overlay of config file change event. That should be helpful?
-
Exceptions (Error Tracking)
- Events that indicate programming errors should be recorded in a ticket tracking system, then assigned to a engineer for diagnosis and correction.
- Exceptions
- Pass down the Thread local storage, stack trace etc
- Use some error tracking system like sentry etc.
-
Profiles
- Profiles (Mem, CPU, Mutex etc). Things that work here usually don’t directly work with Distributed Systems
- Code hotspots are best identified via Profiling, not tracing.
- See Parca - Open Source infrastructure-wide continuous profiling
Observability in dev/testing time
- Strive to write debuggable code (being able to ask questions in the future, via metrics, logs, traces, exceptions, combination etc)
- We should be testing for failure aswell
- Best effort failure mode simulation, we can’t catch all failure modes.
- We can be aware of the presence of failures
- We can’t be aware of absence of failures ever
- Assume the system will fail
- Dev should be aware of things like
- How deployed? envars?. How it gets loaded/unloaded
- How it interacts w network? how it disconnects, exposed?
- How it handles IPC, configs
- How it discovers other stuff etc etc
- Understand leaky abstractions of dependencies
- Default configs of dependencies
- Caching guarantees of dependencies
- Threading model of dependencies
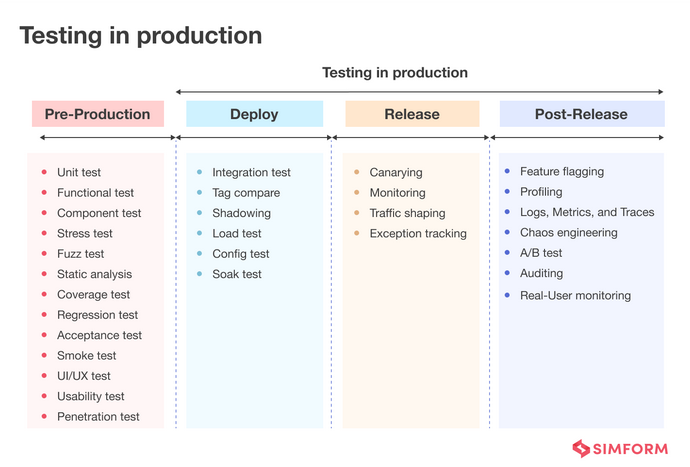
Testing in prod
- Essentially means we can check something on a live system and the system allows us to see what’s happening to the system when we want to check it.
Pillars
Monitoring
Boxes
- Blackbox: Symptom based(effect), less trigger(cause) based
- Whiebox: We get data from inside of the system. (Detailed stuff)
What it need to give
- Show the failure (health)
- Impact of the failure (health)
- Ways to dig deeper (health)
- Effect of fix deployed (change)
What metrics to use?
-
USE (System Performance)
- U: Utilization
- S: Saturation
- E: Error
-
RED (Request Driven Applications)
- R: Req. Rate
- E: Req. Error Rate
- D: Req. Duration (Histogram)
-
LETS (For Alerting)
- L: Latency
- E: Error
- T: Traffic
- S: Saturation
-
Databases
- No. of queries made v/s no. of rows returned
-
Other practices
- We want to drop timeseries data that we don’t need to save bandwidth and space
- We don’t want to monitoring everything really, we want to properly define our SLOs and monitor those
- Closely track the signals that best express and predict the health of each component in our systems.
-
Instrumentation
- We can see what we can monitor out of libraries that our program use. Eg. I think
pgxexposes a stats function which can be nice data to instrument and send to prometheus. - For any sort of threadpool, the key metrics are the number of queued requests, the number of threads in use, the total number of threads, the number of tasks processed, and how long they took. It is also useful to track how long things were waiting in the queue.
- We can see what we can monitor out of libraries that our program use. Eg. I think
Cardinality
- We need to keep cardinality low but in certain cases tradeoffs are worth it
-
For health
- We often need cardinality to hone in on signals we actually care about.
- i.e if there’s cardinality increase for
proactivemonitor useful for indicating health, we probably want it. (proactiveandhealthare the keyword here)
-
For change
- Increasing cardinality so that we can you can explain the cause of something(
explain changes) is probably the wrong way to go. - Eg. After a painful outage, say you realize a single customer DOSed your service. So someone adds a `customer` tag “for next time.”. We don’t want to do this because it’s unsustainable, both the process of adding another label to find cause and the customer tag.
- Distributed systems can fail for a staggeringly large number of reasons. You can’t use metrics cardinality to isolate each one.
- Instead look for observability that
- (a) naturally explains changes
- (b) relies on transactional data sources that do not penalize you for high/unbounded cardinality.
- Increasing cardinality so that we can you can explain the cause of something(
Types of metrics
-
Constants
-
Counters
- Can only increase during the lifetime of the system.
-
Gauges
- Can vary freely across its possible value range.
-
Distributions
- This is in-practice sometimes called Histogram (See Data Visualization, Prometheus)
-
Binning
- client-side binning
- Reporter decides buckets
- Usually configurable per-metric
- Changing the binning can cause vertical aberrations in visualisations.
- collector-side binning
- Client reports the events as-is, collector aggregates before storing.
- Eg: collector receives raw distribution samples from its clients, and records {50,90,95,99}th percentiles over a trailing window.
- Less flexible
- client-side binning
-
Summaries
- Prometheus has summaries
Logging
See Logging
- Sometimes we log with the idea that when something goes wrong, maybe i’ll come dig the log and find something useful. A better way for some of those cases would be to send a error report of something right from the program if in any-case that log needs to be “seen”.
- Log derived metrics are okay sometimes
Tracing
######################## GET /user/messages/inbox
###### User permissions check
#### Read template from disk
######### Query database
### Render page to HTML
## Compress response body
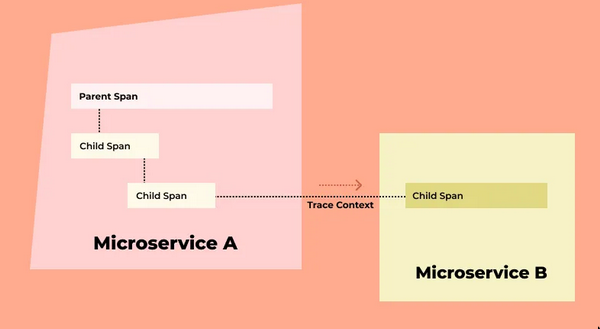
###### Write response bodyTraces are used to understand the relationship between the parts of a system that processed a particular request. This is more useful in Distributed Systems.
Concepts
Analogy:
- A trace => stack trace
- A span => A single stack frame.
- stack frame push-pop => span begin-end
- Trace
- Tree of
spans - A trace is constructed by walking the tree of
spansto link parents with their children. - It’s the timing of
spansthat is interesting when analysing atrace.
- Tree of
- Spans
- Single operation within a
trace - Logical region of the system’s execution time. (A duration distribution)
- Spans are nested
- Root span : No parent
- Other spans: Have parent
- All spans except the root span have a parent span
spanshaveattributes
- Single operation within a
- Trace Context
- Examplars
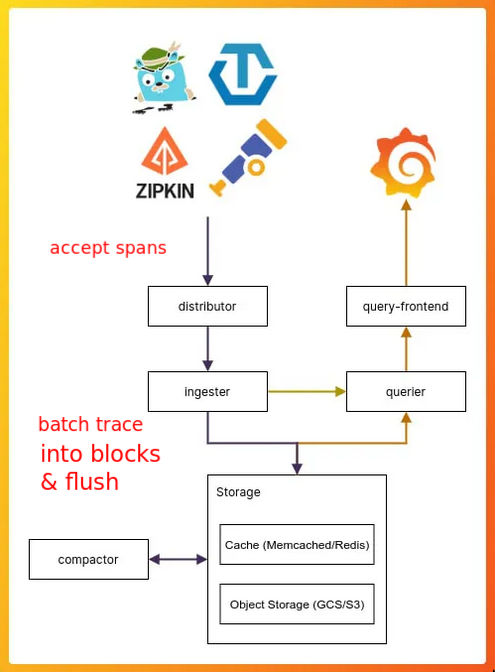
Grafana Tempo
Auto vs Manual instrumentation for otel
-
Auto
- Straightforward process that involves setting some environment variables (or via another configuration format)
- Generates telemetry for underlying runtime components, but it cannot see inside your custom application logic to understand what’s going on.
- Helps you understand the context surrounding your application
-
Manual
-
Enrich spans
- Adding attributes to the current span (even ones created by auto-instrumentation) to capture useful information.
- Eg. adding a userID to a span to understand which users are calling a particular endpoint
- Eg. recording cache hit/miss
-
New spans
- Eg. a web application may create a span when making a database call to encapsulate when the call is made and enrich it with the query parameters.
-
-
In practice
- In practice we need both
Learn more about tracing
- Headers, a lot of headers. That’s how it works :p when your application receives a request it needs to extract the trace parent and the rest of the trace context from headers. So whatever makes the request to your API should generate a parent trace ID and attach that to the request. If the request caused subsequent requests the trace parent should be passed in headers. There are multiple specs for those. We’ve chosen the W3C one as it’s vendor agnostic and has a lot of community support. I’d recommend going through that spec.
Concerns on Tracing
-
Trace size
- We need not worry about any cardinality issues when adding attributes to traces
- APM provider(sentry) does not bill by the size of the unit but by the number of units. So feel free to chuck-in as many attributes to traces that you want.
- Only concern is egress traffic, which should be fine for now
-
How much should we sample?
-
Log sampling
- What if a service that usually doesn’t log so much starts logging excessively because some other service failed
-
Error/Event sampling
- What goes for log sampling goes for error/event sampling as-well.
-
Concepts
Latency
- Finish watching “How NOT to Measure Latency” by Gil Tene - YouTube
- Want to Debug Latency?
- The Latency/Throughput Tradeoff: Why Fast Services Are Slow And Vice Versa – Dan Slimmon
- w databases, we’ll have Database latency + Network latency
Percentiles
Reminded me about a story when Google tried to optimise their response times in Africa. Because of poor infra, many users were getting timeouts when searching on G, so they worked to improve it. They managed to cut number of bytes, change geo-location of some switches, and what they saw that the average response time increased, but their p99 stayed the same. What really happened is that users who never could connect before, became their >p95 and p99, and users who were p99 became p60-p80. So G engis made positive changes, but the numbers didn’t reflect it. Is average and p90 BS, and what’s the alternative?
The lesson here is that all models are wrong, but some are useful It’s not about what is BS and isn’t, it’s just a simple number, the problem is how you use it. If it’s useful for you and you know how to use it, then a blog post shouldn’t stop you from doing it.
- Some orange side guy
See Statistics
Other related ideas in telemetry
Dashboards
Whither Dashboard Design? | Hacker News
- Dashboards are nice but do read this
- Debugging: “You come along trying to investigate something, and what do you do? You start skimming through dashboards, eyes scanning furiously, looking for visual patterns — e.g. any spikes that happened around the same time as your incident. That’s not debugging, that’s pattern-matching.”
OpenTelemetry
- Basically this is hot shit. In some sense, OTEL is very much the k8 for observability (good and bad)
- OTel lets the open source projects use an abstraction layer so that you have an option to
buyinstead ofself-hostin any cases.- “oh shit, all this open source software emits Prometheus metrics and Jaeger traces, but we want to sell our proprietary alternatives to these and don’t want to upstream patches to every project”. - Some guy
- Otel is great for avoiding vendor lock-in
- A vendor-agnostic replacement for the client side of DataDog, New Relic, or Azure App Insights.
Pros&Cons
-
Pros
otel-collectorit’s easy to get logs, tracing and metrics in a standardised manner that allows you to forward any metrics/tracing to SRE teams or partners.- Eg. send logs to Splunk, traces to New Relic & metrics to Prometheus. Also send a filtered traces and logs to a partner that wants the details.
- devs can add whatever observability to their code and ops team can enforce certain filtering in a central place as well as only needing one central ingress path that applications talk to.
- Despite of the cons, there seems to be no better alternative that otel. The alternative of not using otel is you’ll have to export data in certain
exposition formatwhich will not be compatible w other backends handling that data(monitoring/logs/traces), but sometimes that’s all you need.
-
Cons
- OT might good for a certain language/stack and completely suck for another. Eg. exemplars are not supported in JavaScript/Node.
- “It doesn’t know what the hell it is. Is it a semantic standard? Is a protocol? It is a facade? It is a library? What layer of abstraction does it provide? Answer: All of the above! All the things! All the layers!” - Someone on orange site
- “Otel markets itself as a universal tracing/metrics/logs format and set of plug and play libraries that has adapters for everything you need. It’s actually a bunch of half/poorly implemented libraries with a ton of leaky internals, bad adapters, and actually not a lot of functionality.” - Another user on orange site
- “OTel tries to assert a general-purpose interface. But this is exactly the issue with the project. That interface doesn’t exist.” - Another guy
OTel Collector Implementation
- It usually does not need to listen on any ports
- OpenTelemetry collector implements a Prometheus remote write exporter.
- Collector is a common metrics sink in collection pipelines where metric data points are received and quickly “forwarded” to exporters.
-
Components of a “Collector”
- Receiver
- Processor
- Exporter
- Collector vs Distro?
Instrumenting with OTEL
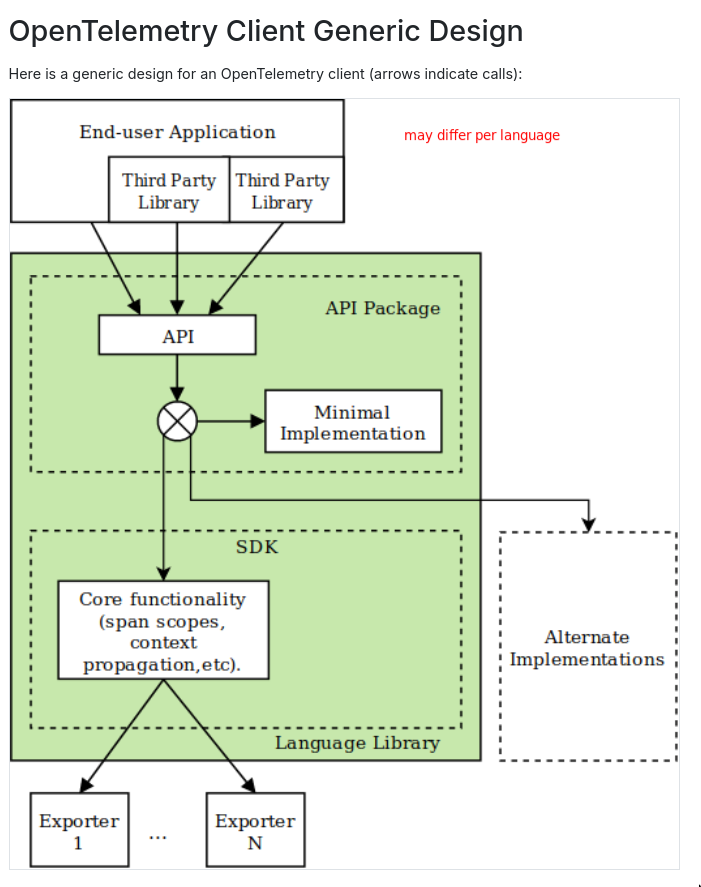
- OTEL client: 4types(logically) of packages, API , SDK, Semantic Conventions, plugin
- Libraries can and will only use the API package.
- If your application does not use the SDK, it'll NOT produce any metrics, library OTEL API calls would be no-op
- If your application includes OTEL SDK, it'll produce telemetry data even if you don't do any instrumentation because the underlying library probably is instrumented. This is configurable ofc.
- The API package includes a ~minimal implementation~
- When you use the SDK package, the ~minimal implementation~ is substituted by the SDK package- Pick latest stable release instead of latest release
API & SDKare the 2 main modules of OpenTelemetryAPI: set of abstractions and not-operational implementations.
- If writing a library(to be consumed) we only need and should only use the
OTEL API- When you write a library you can not know what specific OTEL implementation(SDK) the application dev is using, so we only use the
OTEL APIandNOT the OTEL SDK
- When you write a library you can not know what specific OTEL implementation(SDK) the application dev is using, so we only use the
- If writing a process/service which will be the one that runs, we only need the
OTEL API + OTEL SDK - We can also do zero-code instrumentation via env var or language specific options
- Only some(python, javascript) languages are supported
-
Using OTEL API
- You need a
providerinstance here- Trace: Create
tracer provider - Metrics: Create
meter provider - The SDK usually provides this, you have to give it a
name(fqdn) andversion- This
nameis important as it gets used in traces(deps etc.)
- This
- Trace: Create
- Extract and Inject
- Extract
- When your code(eg. message consumer/framework) is receiving upstream calls
propagator.extract: Extract parent context- Create new span, set info and also set the extracted parent context
- Inject
- When your code is making outbound calls
- Make a span to keep track of the outbound call (Eg.
send) propagator.inject: Inject current context, which will be the created span after it’s marked active.
- Extract
- You need a
-
Using OTEL SDK
- The SDK is the implementation of the API provided by the OpenTelemetry project.
- SDK needs to be configured with appropriate options for exporting to the collector
- We can send it in 2 ways
- Directly to a backend
- Import the exporter(eg. prometheus/jaeger) library
- Translate the OTEL in-memory objects into what the exporter expects, send to the backend via the exporter
- via a OTEL collector (I prefer this)
- Use
OTLP wire protocol, supported by OTEL SDK(s) and then we can send the data to acollector collectoralso understandsOTLP wire protocol
- Use
- Directly to a backend
-
Signal specific notes
-
Metrics
See Prometheus for more info on instrumenting with OTEL (It also has a section on instrumenting with pure prometheus)
-
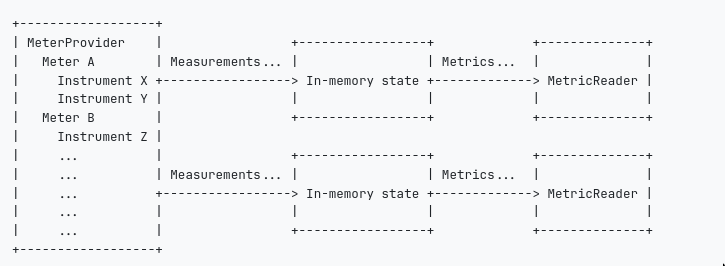
Components
Components:
Measurement,InstrumentandMeterMeterobtained fromMeterProviderMeteris used to createInstrumentInstrumentis used to captureMeasurement- Can be sync or async
Views: Views is an extra component can be applied atMeterProviderorMeterlevel to do transformation etc.
-
Datamodel
- Data model: Metrics Data Model
Event modelused by the APIin-flight modelused by the SDK and OTLPTimeSeries modelfor exporters
SKIP VALIDATION: code dealing with Metrics should avoid validation and sanitization of the Metrics data. Instead, pass the data to the backend, rely on the backend to perform validation.
- Data model: Metrics Data Model
-
- Traces
-
Tips&Gotchas
- Use
eventsorlogsfor verbose data instead ofspans - Always attach
eventsto thespaninstance that your instrumentation created. - Avoid using the active span if you can, since you don’t control what it refers to.
Making a span activeallows any nested telemetry is correlated to be collectedcurrentandactivespan is used interchagbly
- OTEL will not error out during runtime as a design decision
-
Instrumenting in python
- OTel SDK - Blog by Roman Glushko
opentelemetry-bootstrap: A helper program that scans the current site-packages and then installs the needed instrumentation packes for auto-instrumentation of underlying libraries.- In a real-world example, I think it’s not ideal to run this as part of the docker image etc. Just figure out the deps required and install them using your package manager. This seems like a huge anti-pattern to me idk why they decided to introduce such tooling.
- I also think auto-instrumentation is pretty bad. why would you do all that. idk for languages other than python might be good haven’t explored yet but python so far my experience with auto instrumentation has been awful. I mean the outcome is awesome but the current tooling sucks. Also if its so open open why are so many examples so specific to certain frameworks man, iam just a bitter man at this point. i should sleep.
- https://pypi.org/project/opentelemetry-instrumentation/
- auto-instrumentation and instrumenting your dependencies by importing the instrumentation package of the underlying library are mutually exclusive.
- I honestly prefer not going with auto-instrumentation. It also messes up with how you have the launch the program, i.e you need to use
opentelemetry-instrumentcli tooling.
-
Debugging
- If you’re not using
opentelemetry.sdk.metrics.exportdirectly eg.ConsoleMetricExporteryou won’t be seeing the metrics in the console(terminal) even if you have setexport OTEL_METRICS_EXPORTER=console- In those cases you need to use the
opentelemetry-instrumenttool by using it something like:opentelemetry-instrument python -m src.main
- In those cases you need to use the
- If you’re not using
Useful Links
APM
- APM it’s usually via a vendor SDK or agent. You have to invest in that SDK or agent and it’s not portable.
- But you can instead use OpenTelemetry, which is portable
War Stories
Scaling observability
- At a large enough scale, it is simply not feasible to run an observability infrastructure that is the same size as your production infrastructure.
When overloaded you should be doing as little work as possible
Basically what’s happened for us on some very high transaction per second services is that we only log errors. Or Trace errors. And the service basically never has errors. So imagine a service that is getting 800,000 to 3 million request a second. And this is happily going along basically not logging or tracing anything. Then all the sudden a circuit opens on redis and for every single one of those requests that was meant to use that open circuit to redis you log or trace an error. You went from a system that is doing basically no logging or tracing to one that is logging or tracing at 800,000 to 3 million times a second. What actually happens is you open the circuit on redis because red is a little bit slow or you’re a little bit slow calling redis and now you’re logging or tracing 100,000 times a second instead of zero and that bit of logging makes the rest of the requests slow down and now you’re actually within a few seconds logging or tracing 3 million requests a second. You have now toppled your tracing system your logging system and the service that’s doing the work. Death spiral ensues. Now the systems that are calling this system starts slowing down and start tracing or logging more because they’re also only tracing or logging mainly on error. Or sadly you have a better code that assumes that the tracing are logging system is up always and that starts failing causing errors and you get into doing extra special death loop that can only be recovered from by only attempting to log or error during an outage like this and you must push to fix. All the scenarios have happened to me in production.
- So prefer sampling errors, See Logging
Tactical stuff
What to monitor for?
Some notes on metrics
- What we monitor should ideally describe customer experience / describe our system
- Following are some base/ideal metrics to have. Also see Metrics For Your Web Application?
- Ideally this list wouldn’t exist and we’ll have appropriate dashboards/tools for all
Application
| Metric | Description |
|---|---|
| Realtime API Endpoint stats | Which endpoints are being hit, how many times etc. |
| Synthetic API Endpoint stats | Preemptive checks to ensure correctness, delivery speeds etc |
| RED Metrics | Req(Rate,Error,Duration) |
| Cache hit/miss rate |
Database
| Metric | Description |
|---|---|
| Availability | |
| Connections | |
| Database size/growth rate | |
| queries made/rows returned | |
| Connection Pool metrics | Don’t use a pool at the moment |
| Response Latency | |
| Cache hit/miss | |
| Calls to the db/min | |
| Client side DB pool | |
| Server side DB pool |
-
Memory usage metrics in Containers
Beyond that, effectively everything else is OS cache. If you’re using some kind of memory usage chart such as Prometheus or Grafana, these almost always rely on the memory.usage_in_bytes cgroup value, which is a huge problem. This metric also includes the active_files metric which is any memory that has been requested multiple times and is consuming filesystem cache space.
If you have terminal access to your container instance, check /sys/fs/cgroup/memory/memory.stat and pay special attention to the shmem and rss fields; that’s actually what Postgres is using. You may notice that active_anon and active_file are very high as well, and these are the cache data that’s making memory usage look higher than it really is.
see https://www.reddit.com/r/PostgreSQL/comments/1d0cjv3/need_help_diagnosing_high_memory_usage/
- In cadvisor + PostgreSQL, you want to be checking for
container_memory_working_set_bytes.
- In cadvisor + PostgreSQL, you want to be checking for
System
| Metric | Description |
|---|---|
| Service Availability | |
| Service Health | |
| Node/Host metrics | fd,io,mem,cpu,threads etc. for USE |
TODO Batch jobs
- Also see Batch Processing Patterns
- The thing to consider about these metrics is that they should not include data, that changes between invocations (e.g. job IDs).
- https://gitlab.com/gitlab-com/runbooks/-/blob/master/docs/uncategorized/job_completion.md
- https://gitlab.com/gitlab-com/runbooks/-/blob/master/docs/uncategorized/periodic_job_monitoring.md
- throughput? latency?
| Metric | Description | Type | Priority |
|---|---|---|---|
| job_success_timestamp_seconds | unix time(seconds) when the job completes succesfully. set to 0 at job start. | Gauge | Need |
| job_start_timestamp_seconds | unix time(seconds) when the job starts. | Gauge | Need |
| job_failed | boolean value of the job completion status | Gauge | Need |
| job_total_duration_seconds | Histogram | ||
| job_x_phase_duration_seconds | Histogram | ||
| total records processed | - | ||
| Job state transitions | Nomad summary should give this? |
- Notes
last_runmetric- We can have alerts on this. Eg.
time() - last_run_seconds > 3600etc - The don’t want the
last_runas label but as a value of the metric. As a label we’ll have cardinality explosion.
- We can have alerts on this. Eg.
-
TODO NOMAD
- TODO: When using nomad, there’s nomad job summary. Check that.
- https://github.com/hashicorp/nomad/issues/3894
- https://developer.hashicorp.com/nomad/tutorials/manage-clusters/prometheus-metrics
What to alert on?
Some notes on alerts
- We want to be alerted
- When something’s broken
- When something might break
- When something is extra unusual
- Things we want to take care of
- False positives, Duplicate alerts etc.
- Need to define proper failure modes and alert on them
- Ensure receivers are correctly set and right people are notified. We currently only plan on using email and slack, so provision the receiver as per need. Ideally, we want every significant alert to end up on slack at the moment.
- Think about the source of the alert. We can capture the signal for the alert from multiple places, eg. The alert for “too many 4XX” can be triggered from CW ALB metrics as-well as from Sentry. We want to determine the best source and alert from one place only.
- Ideally for every alert we send, we want a dashboard entry/issue for the handler to inspect further
Some alert candidates
| Component |
|---|
| Too many NXX in last M-mins |
| latency is higher than Xs |
Setting up o11y for a product/org
This is going to be super opinionated and i am not going to explain myself
- Use grafana alloy
- A rule of thumb is approximately
10KB/series. We recommend you start looking towards horizontal scaling ofalloyaround the 1 million active series mark.
About Alloy
- When you use alloy, you need not use the official otel collector
Scaling
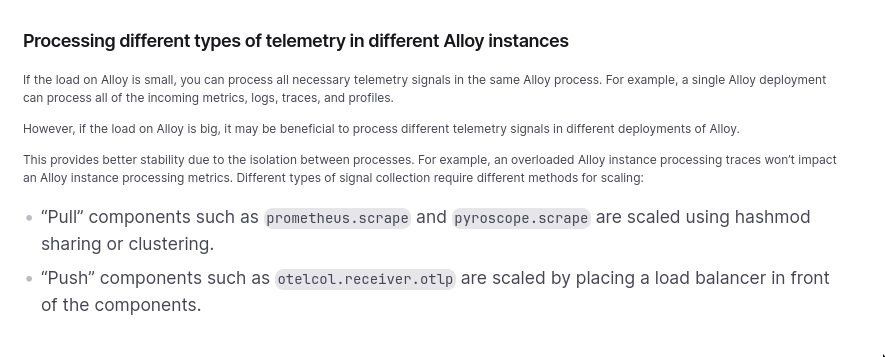
-
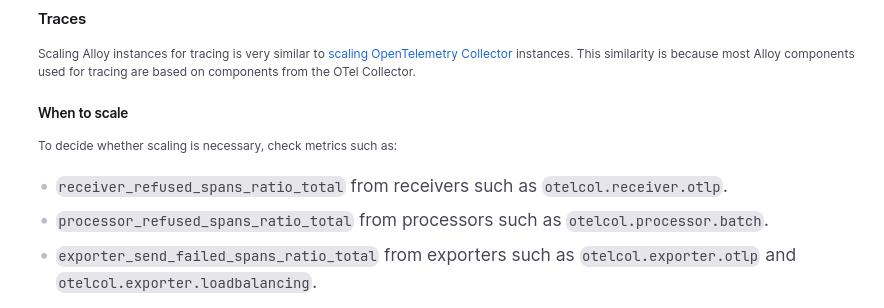
To scale for traces?
Grafana Tips
Graphs
- Stacked graph(s) seems to be buggy, when plotting consider other graphs
Cardinality Management
Querying alloy exporter
When directly running exporter, we can query it directly but when running embedded grafana alloy exporter that’s not possible directly. So we just go curl http://localhost:<alloy_port>/<__metric_path__>, we can get this from the alloy UI. Helpful when debugging.
__metrics_path__ = "/api/v0/component/prometheus.exporter.cadvisor.local/metrics",Understanding Grafana Cloud billing
active seriesanddata points per minuteboth are “grafana cloud” specific termsgrafanacloud_instance_active_seriesgrafanacloud_instance_billable_usage
grafanacloud_org_metrics_included_dpm_per_seriesis what is ALLOWED by the grafana cloud plan you have. Till pro plan you have 1DPM. There’s no point trying trying to scrape more often than 60s when using grafana cloud in this case.- NOTE: Very low scrape interval will cost you monie in grafana cloud! Even if you manage to keep your cardanility low, hosted metrics providers would charge you on data points per min(DPM*active series)
Active Time series and batch jobs
- Usually for batch jobs we would not want the job_id/run_id which differs between runs to part of the labels. But even if this is not the case we are fine with grafana cloud because it won’t count as a active series and will not get billed for it(i think). But ideally we don’t want that run_id w us in labels.
- The concept of an active series is specific to Grafana Cloud Metrics billing. When you stop writing new data points to a time series, shortly afterwards it is no longer considered active.
- A time series is considered active if new data points have been received within the last 20 minutes.
Alerts
On running alertmanager
Alert Manager is designed to be psuedo-clustered with peering, meaning you configure each Alert Manager instance to be aware of its peer Alert Managers. You then configure all of your Prometheus servers to send alerts to all of your Alert Managers. The Alert Manager instances will automatically prevent duplicate alert notifications from being generated via the peering. If there is an issue with an individual Alert Manager or a network partition, alerts will route to available Alert Managers.
Alert Manager vs Grafana Alerts
Let me provide the benefits of Alertmanager
You can follow GitOps and store alerts in git, review every change, deploy and do hot-reload Alertmanager uses query API; it’s cheaper than query_range (as far I know, Grafana alerts uses query range) You likely will use no data alerts in Grafana, and this is an antipattern With Alertmanager you can use an entire opensource ecosystem like cloudflare/pint for example you have the option to integrate Alertmanager alerts with Grafana (and if everything is ok with Grafana native alerts, why they would add this functionality)
- Grafana based alerts have benefits such as you could make alerts across datasources eg. combine alerts and logs etc, link to dashboard directly etc.
- You can even version control grafana alerts but it’s super ugly imo
- Instead I’d prefer their “Data source-managed” alerting offering
GitOps alerts
Resources
I think mimirtool should allow us to load alerts into grafana ui and then we can use grafana alerts ui for it?? unsure.
- https://www.reddit.com/r/devops/comments/1152z00/alerting_prometheus_alertmanager_vs_grafana_alerts/
- https://www.reddit.com/r/sre/comments/1e7s779/prometheus_alertmanager_vs_grafana_alertmanager/
- https://github.com/cloudflare/pint
- Import recording and alerting rules | Grafana Cloud documentation
- https://grafana.com/docs/mimir/latest/manage/tools/mimirtool/#alertmanager