tags : Data Engineering, Creative Programming, Database, Web Animation, Geography
Basics
- Data visualization = Visual communication = story telling
Statistics info
- See Statistics
Histograms
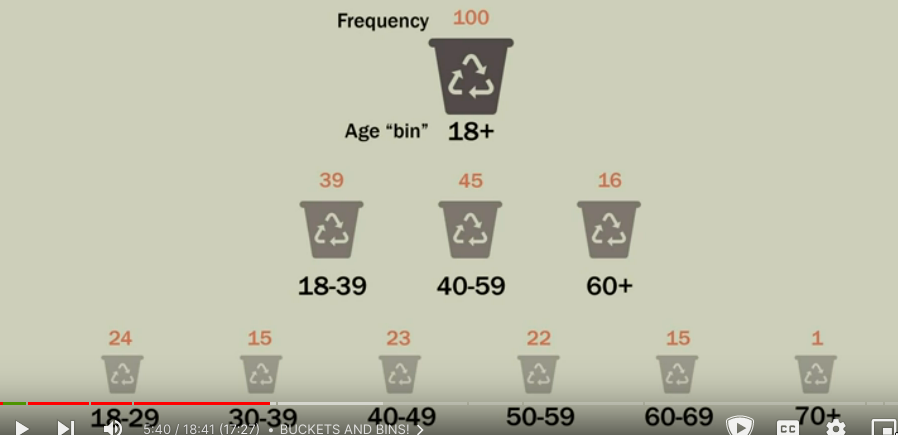
- Histogram is for quantitative data (no space between the bars)
- Can be used to describe a
single variable - It shows the
shape of distributionof values - Axis
X: variable of interestY: Frequency/Relative Frequency/Percent Frequency
- How
- Put the quantitative data into bins that don’t overlap
- Put the number of observations in that bin to see the resolution which tells us about the distribution
- Need to find a balance for “how many bins”
Bar chart vs Histogram
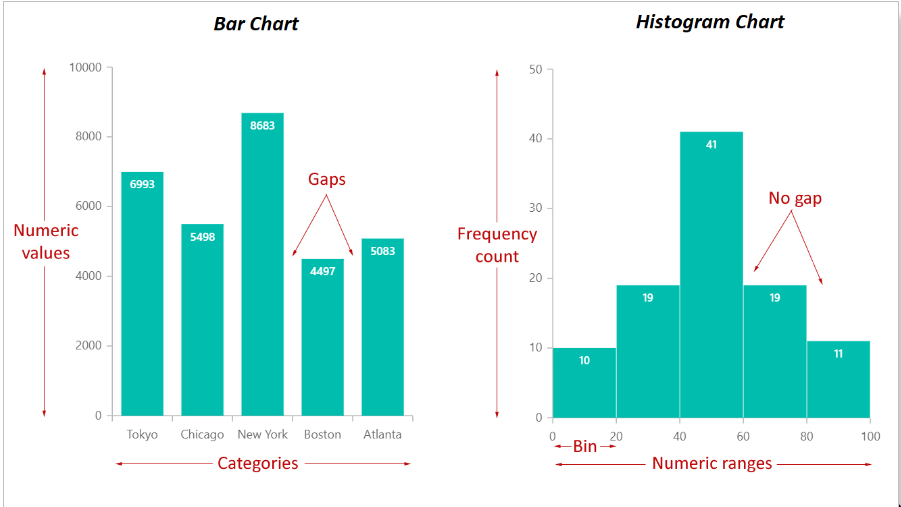
- Bar chart is for categorical data (space between the bars)
Pie charts
Pie charts are very hard to use, maybe just use them when you have fewer categories
Crosstabs (Cross tabulation)
- Often used to show the relationship between two variables
- very flexible and can show different types of information
- The variables can be categorical or quantitative.
- Quantitative variables are often placed into bins or classes like in a histogram
- Size = no. of categories of
Ax no. of categories ofB(whereAandBare variables) - In most software, cross-tabulation is done using
Pivot Tables
Box Plots
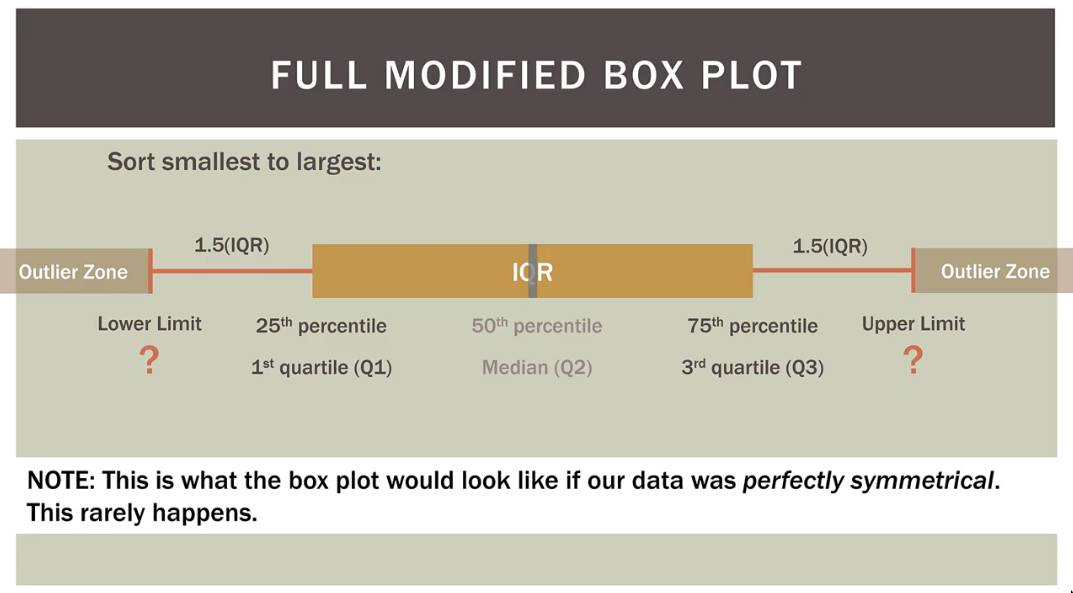
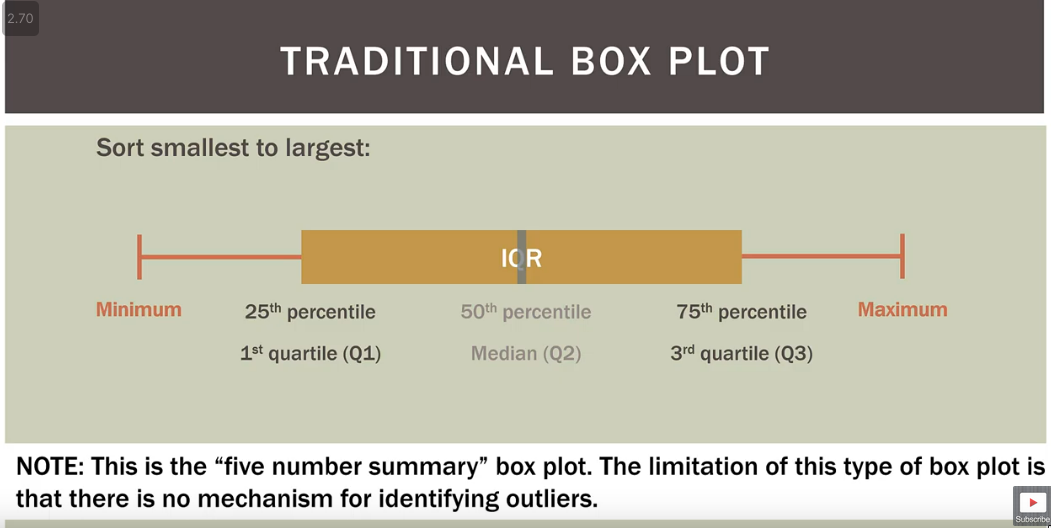
- AKA Whisker plots
- Helps us visualize shape of data
- Normal distribution? Bell curve? Skewed? it can tell u that
- I’ve Stopped Using Box Plots. Should You? | Lobsters
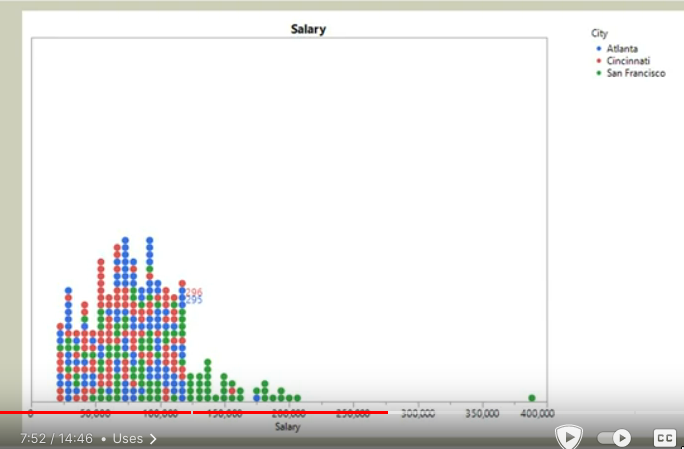
Dot plots
Others
- Box plots, Normal prob. plots, Cum Dist plot show
percentiles
Libraries/Tools
Charting/Graphing
SVG
- D3, Vega
- airbnb/visx : D3 w react
- Misc
CanvasAPI
- ChartJS, Vega
WebGL
Others
PixiJS
-
Process
-
An example
- Sprite container
- Sprite Map : Contain different sprites
- Renderer : Paints the sprite container into our
canvas - Game Loop / Request-Animation-Frame(RAF) loop
- Specify duration for tween and call RAF
- Sprite container
-
Other links
Tools
D3
Learning resources
- https://www.d3indepth.com/gettingstarted/
- https://www.reddit.com/r/sveltejs/comments/126b993/svelte_d3_guides/
- https://www.reddit.com/r/sveltejs/comments/17ieodt/introducing_layerchart/
- https://www.kyrandale.com/bespoke-charts-with-svelte-d3-and-layercake/
- https://reuters-graphics.github.io/example_svelte-graph-patterns/